Katal Solutions
In the age of generative ML there is an unprecedented opportunity to utilize a new breed of tools and frameworks to bring order out of chaos.
This is what we do.
Using suitable machine learning techniques, from local open sourced to enterprise solutions, we analyse your data sources and create a maintanable metastructure which then can be used for ultra fast search, access and visualization.
Katal Solutions proprietary platform is optimized to extract event related data from large and disjointed datasets. This enables fast access and visualization on key data which before would have required slow and tedious manual processing. Please check out use cases and demos at the projects page.
The projects below are examples of the how data and visualization together creates a value greater than the sum of its parts. Note that the Investigation and Exploration projects should be considered fully working pilots. Taking them into production would require quite a few additional steps and testing. Mainly when it comes to data optimization, config and setup of the backend parts. The front end UI is much more self-contained (only depending on the data metalayer) and can easily be deployed on a standard webserver.
Semantic Search The solution consisted of two parts: The Vector Search Processor and the Vector Search API. The Vector Search Processor is a stand alone python application that processes product description exports, transforms them into suitable keyword strings and then ingest them into a ChromaDB vector database in order to enable similarity search. It relies on a running ChromaDB instance, access to an embedding function via OpenAI API as well as access to DeepInfra API for llm keyword generation. The processor constantly monitors for new additions to the product catalogue, through an llm creates appropriate keywords which together with key product data (brand etc) makes the similarity search very powerful. The Vector Search API Server is the "front end" part of the vector search system exposing API endpoints for any external service to use. It relies on a running ChromaDB instance and access to an embedding model via OpenAI API.
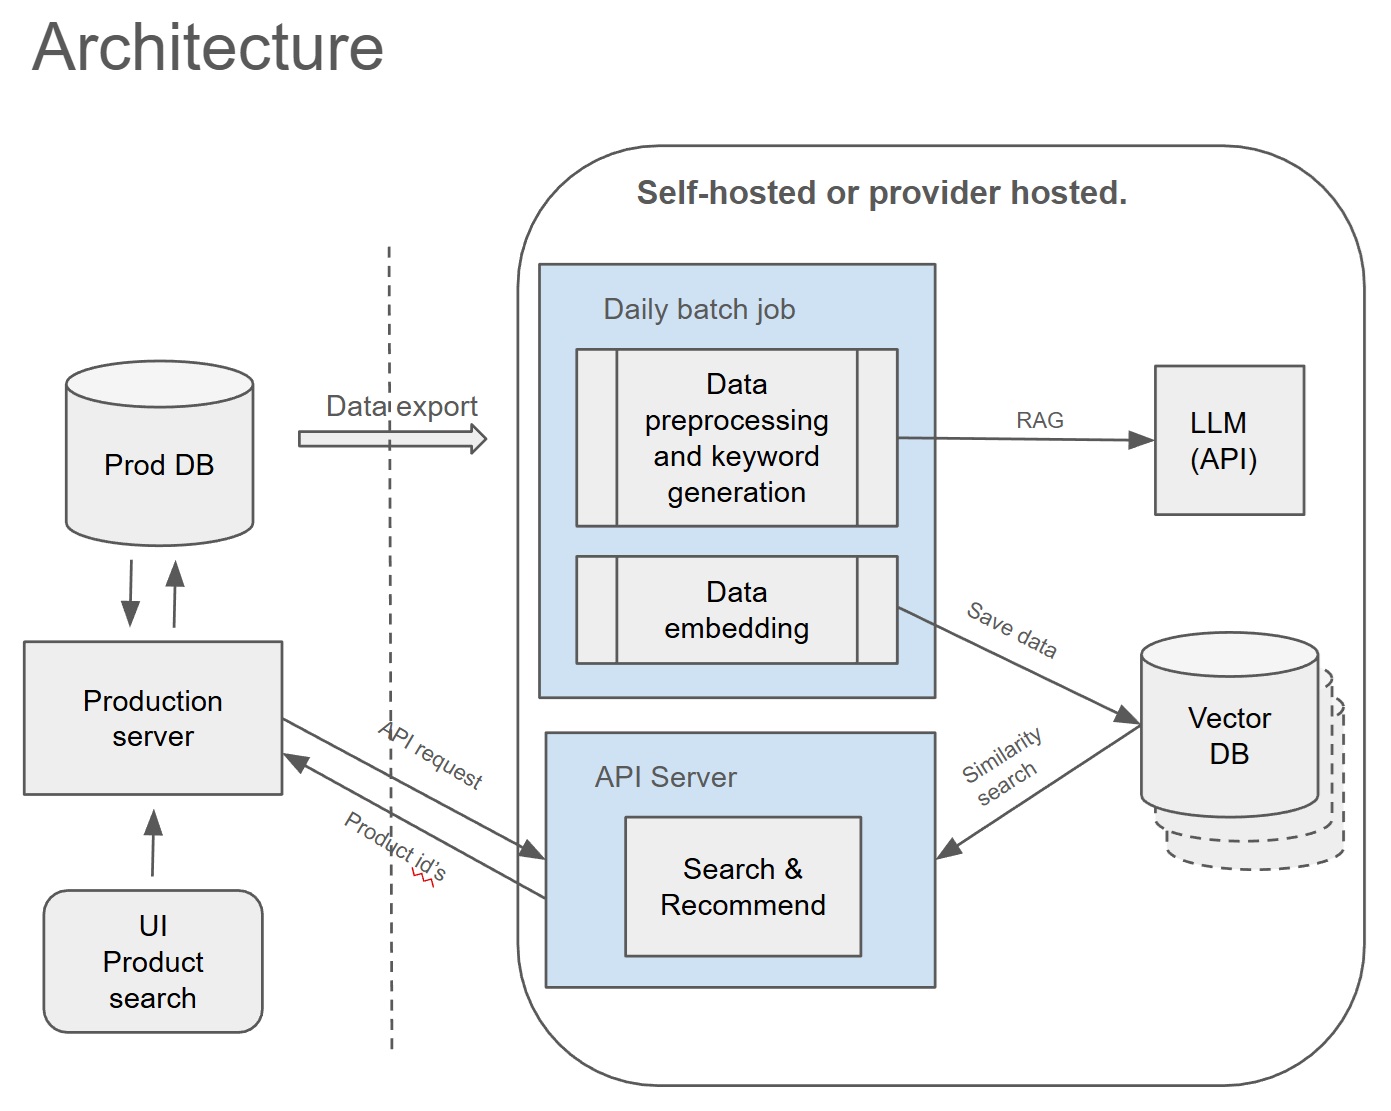
Processor: Python, Docker, Github actions, Pandas. Chroma Vector DB,Models: Open AI API(embedding), DeepInfra API (llm)- Gemma 3 27B
API: Fast API, python, Chroma Vector DB. Models: Open AI API(embedding)
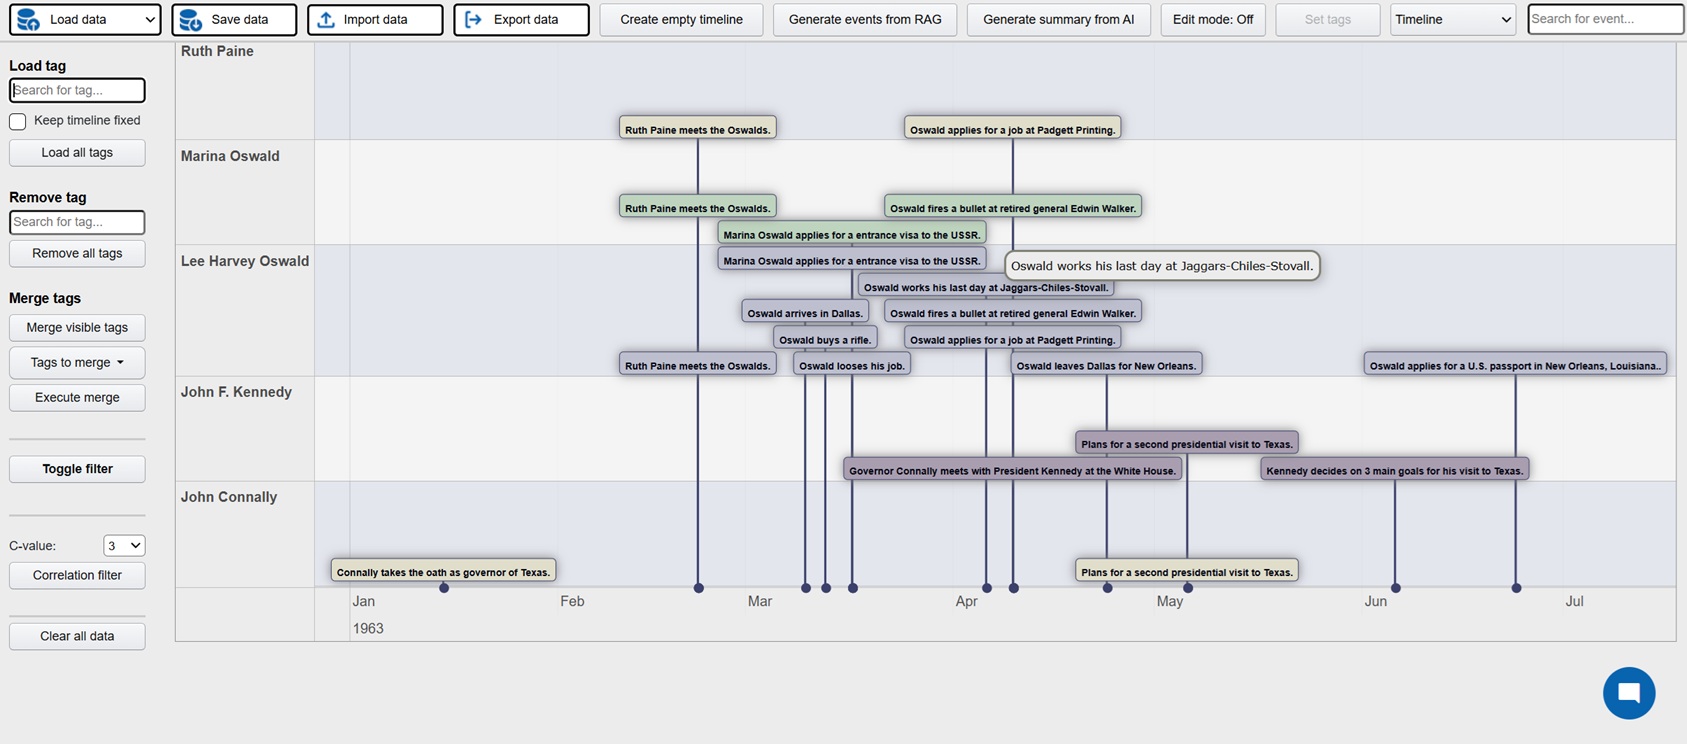
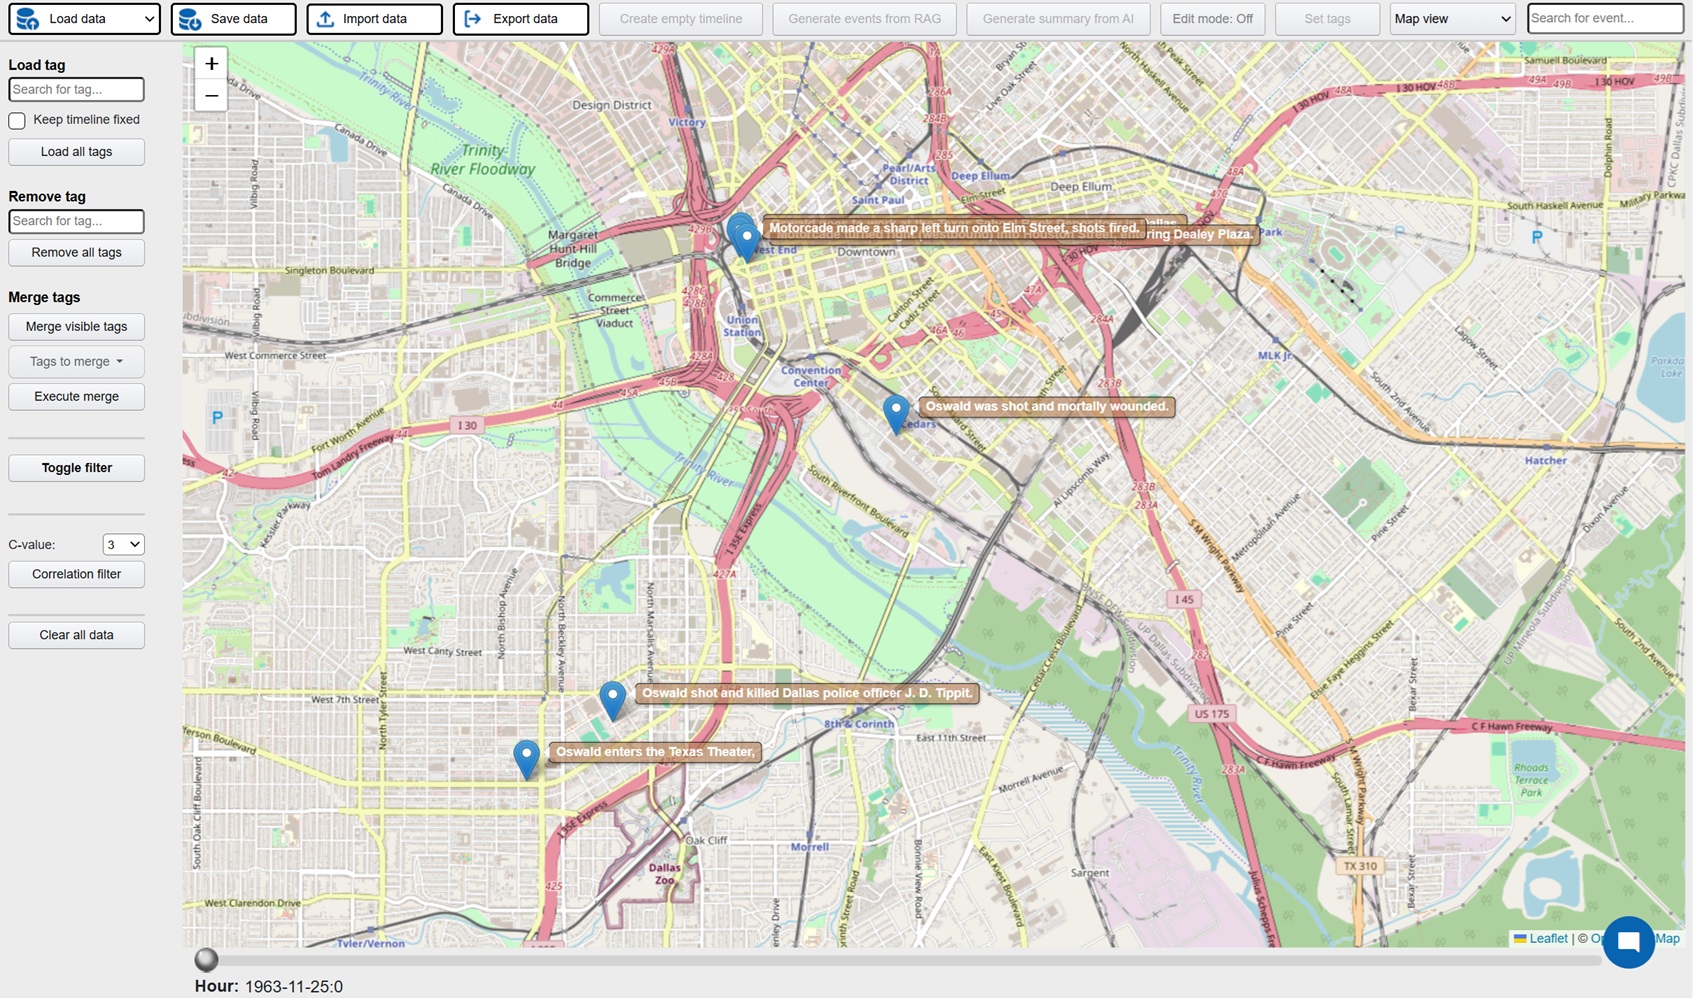
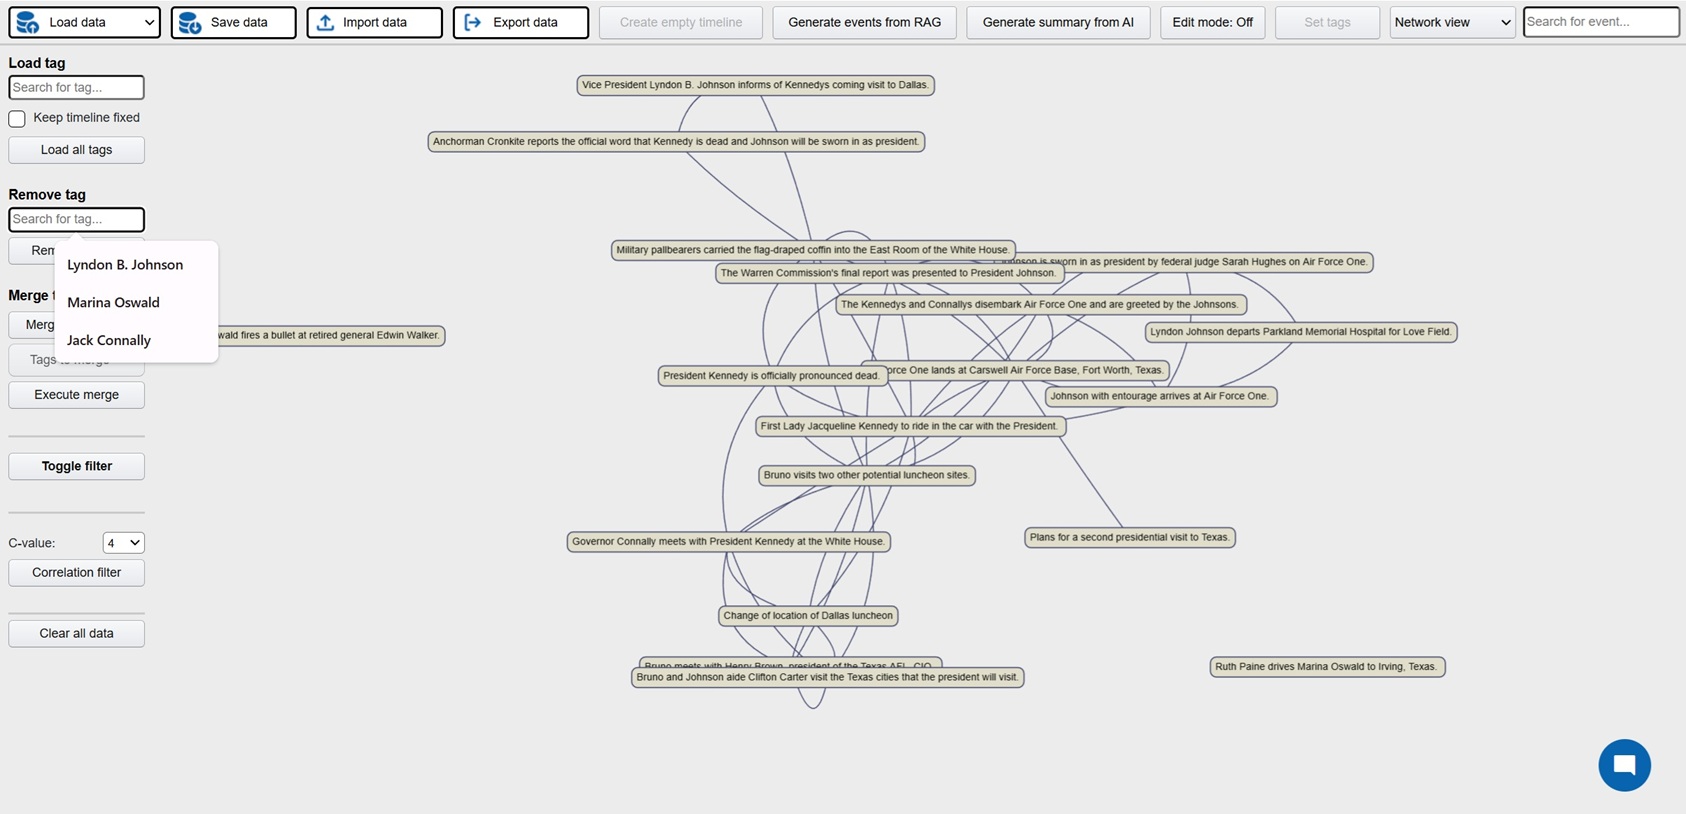
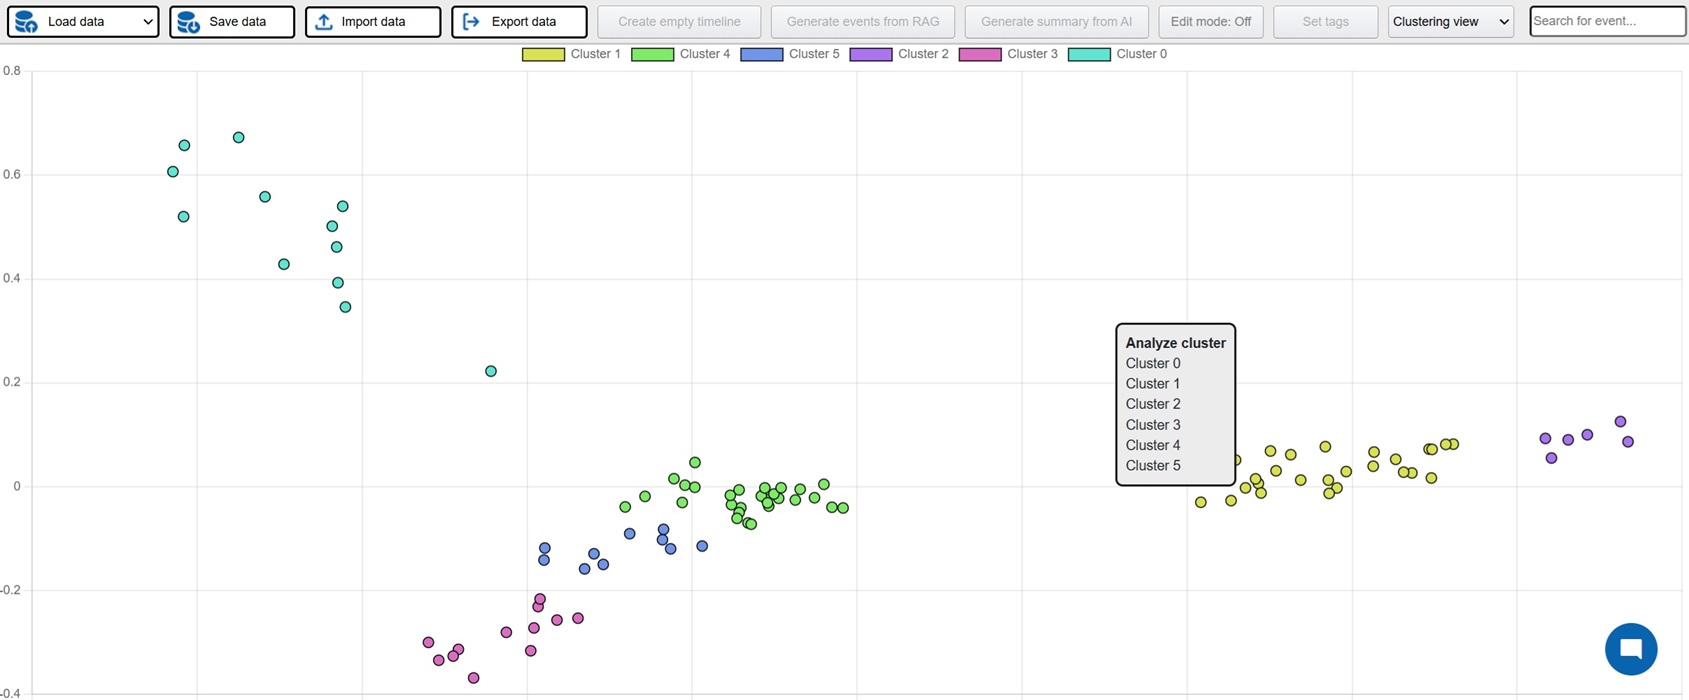
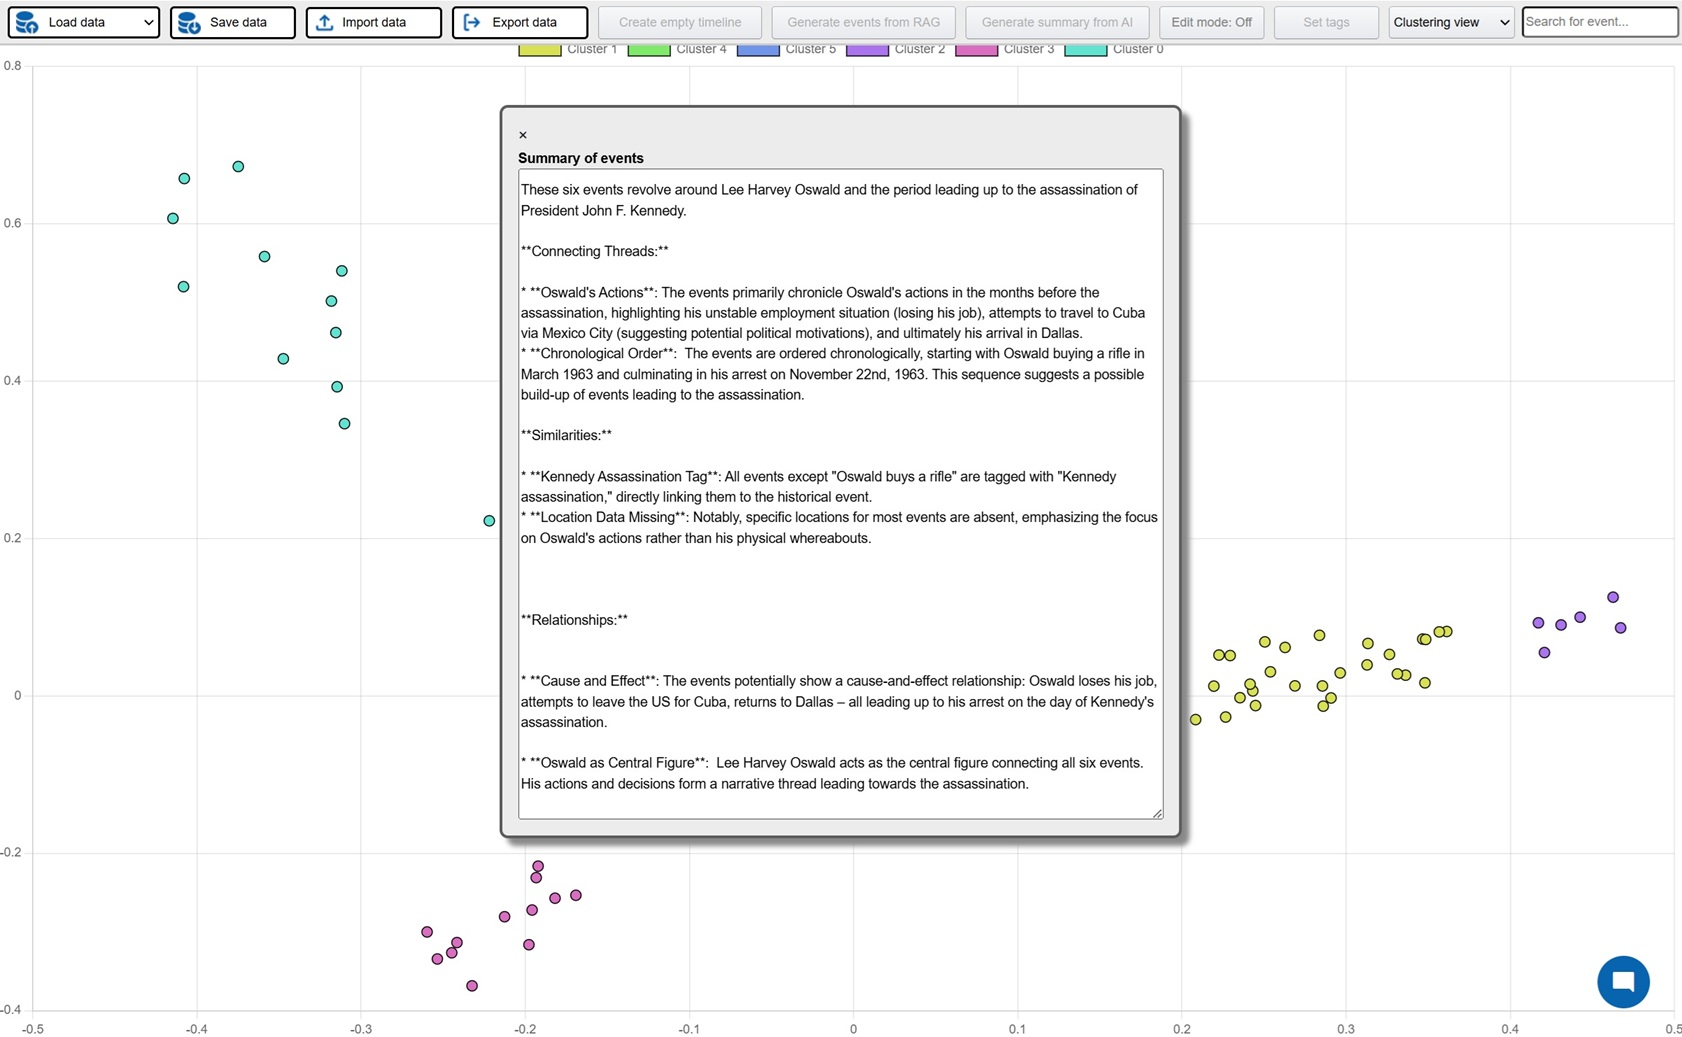
Investigation is a platform where active investigations can be conducted with AI assistance in order to faster build up the case and detect patterns and connections. The possible areas of implementation are many, but obvious cases would be criminal investigations, crash investigations and journalistic investigations. The platform can be used by manually entering relevant events for the investigation, these events can then be visualized in a host of different views: timelines, maps, tables, connection networks and HDBSCAN clustering (semantically related events closer to each other). AI powered features can also be used in order to analyze the events and identify potential relations and connections.
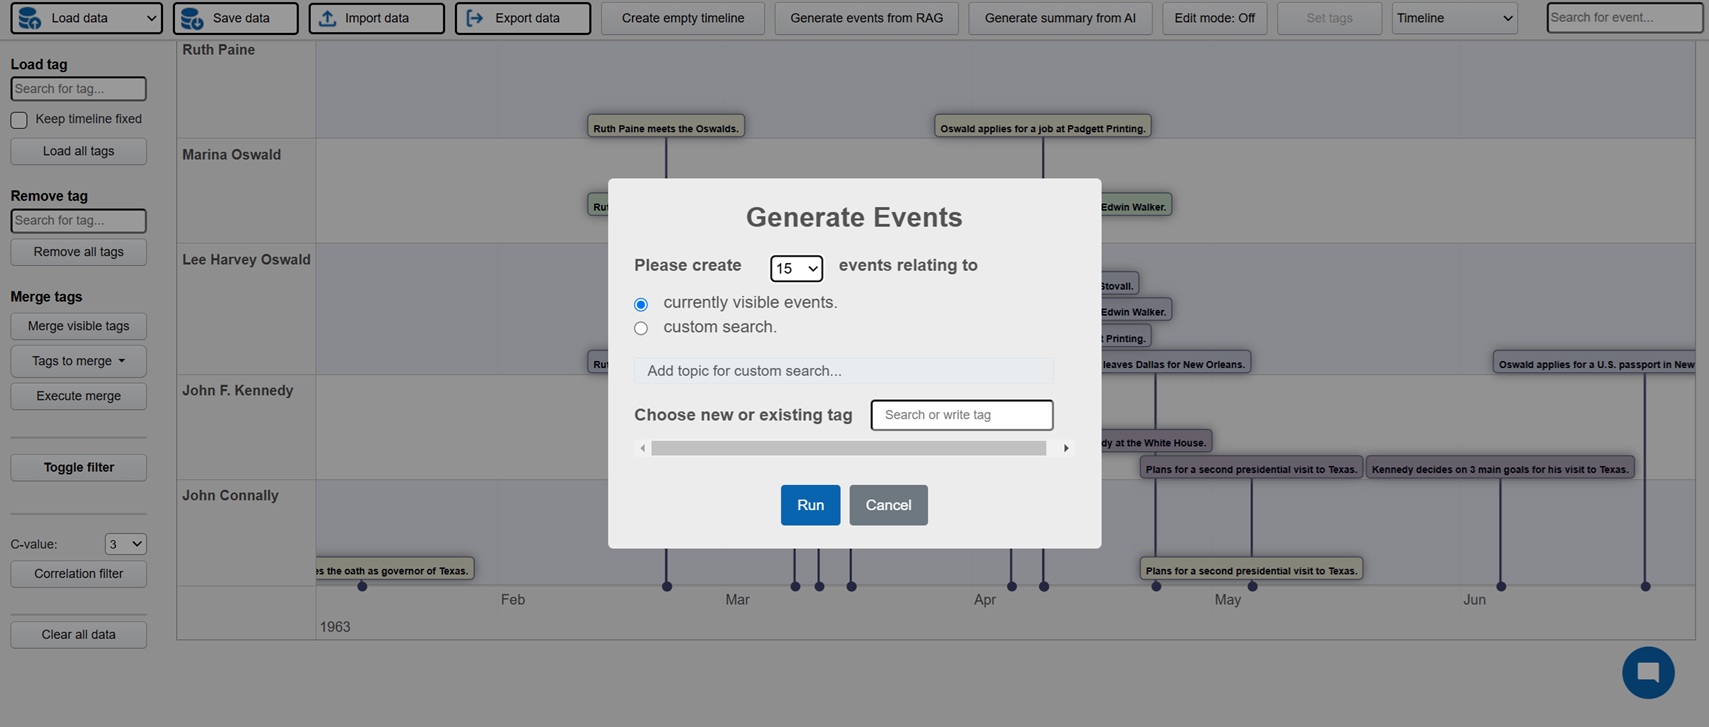
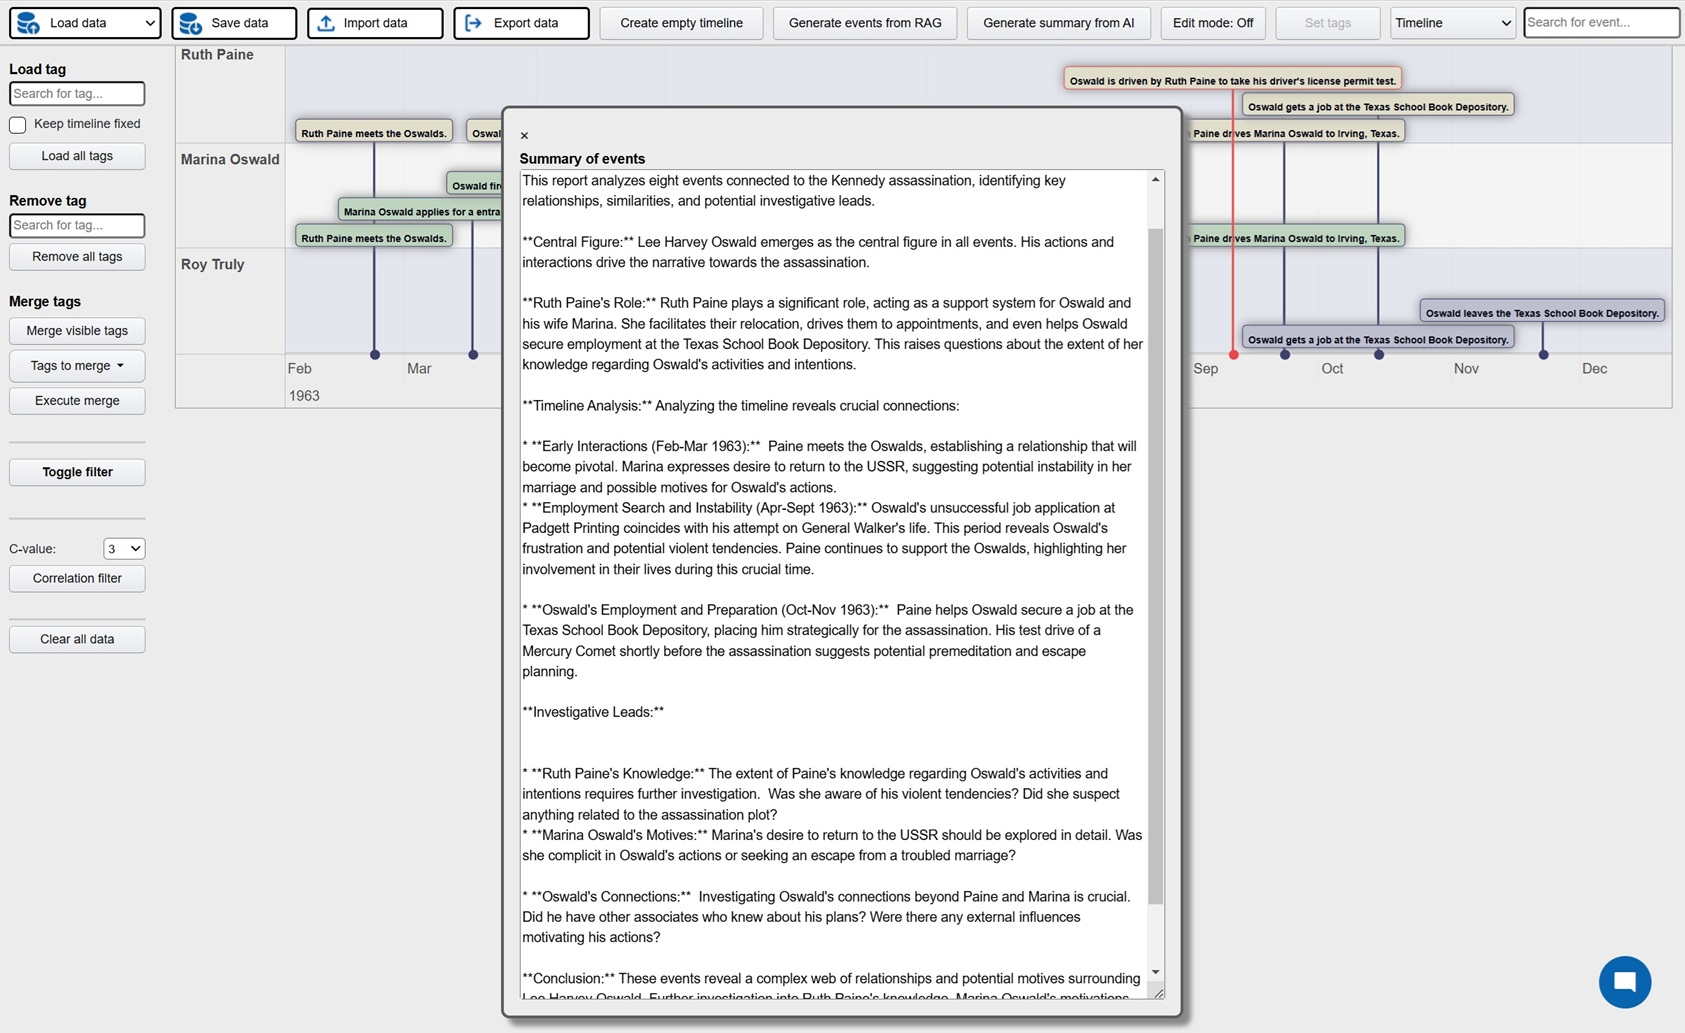
But the real time saver is the ability to use the backend generative system to extract structured events (description, timestamps, locations) from unstructured data. At the core is a RAG system (best RAG config to be decided on results from RAG Test Bench) where all documentation relating the investigative case is processed. After initial setup new documents are continuously added to the embedding database. This enables the user to directly generate events from the data and populate the UI views directly. Generation can be done both from keywords and from instructing the AI to find similar events to those displayed. The user can then select which events are relevant and interesting and persist them in a database which acts at the key data store for the investigation. In addition the investigator can use the chat function to ask questions in natural language.
FE: Javascript, jquery, Bootstrap 4, vis.js, D3, Datatables, leaflet/openstreetmap
BE: Fast API, python, sklearn, nominatim, MongoDB, llamaindex, Ollama, Chroma Vector DB. Models: open source ot enterprise llm's (here: gemma2 27B quant 4),BAAI/llm-embedder, BAAI/bge-reranker-base
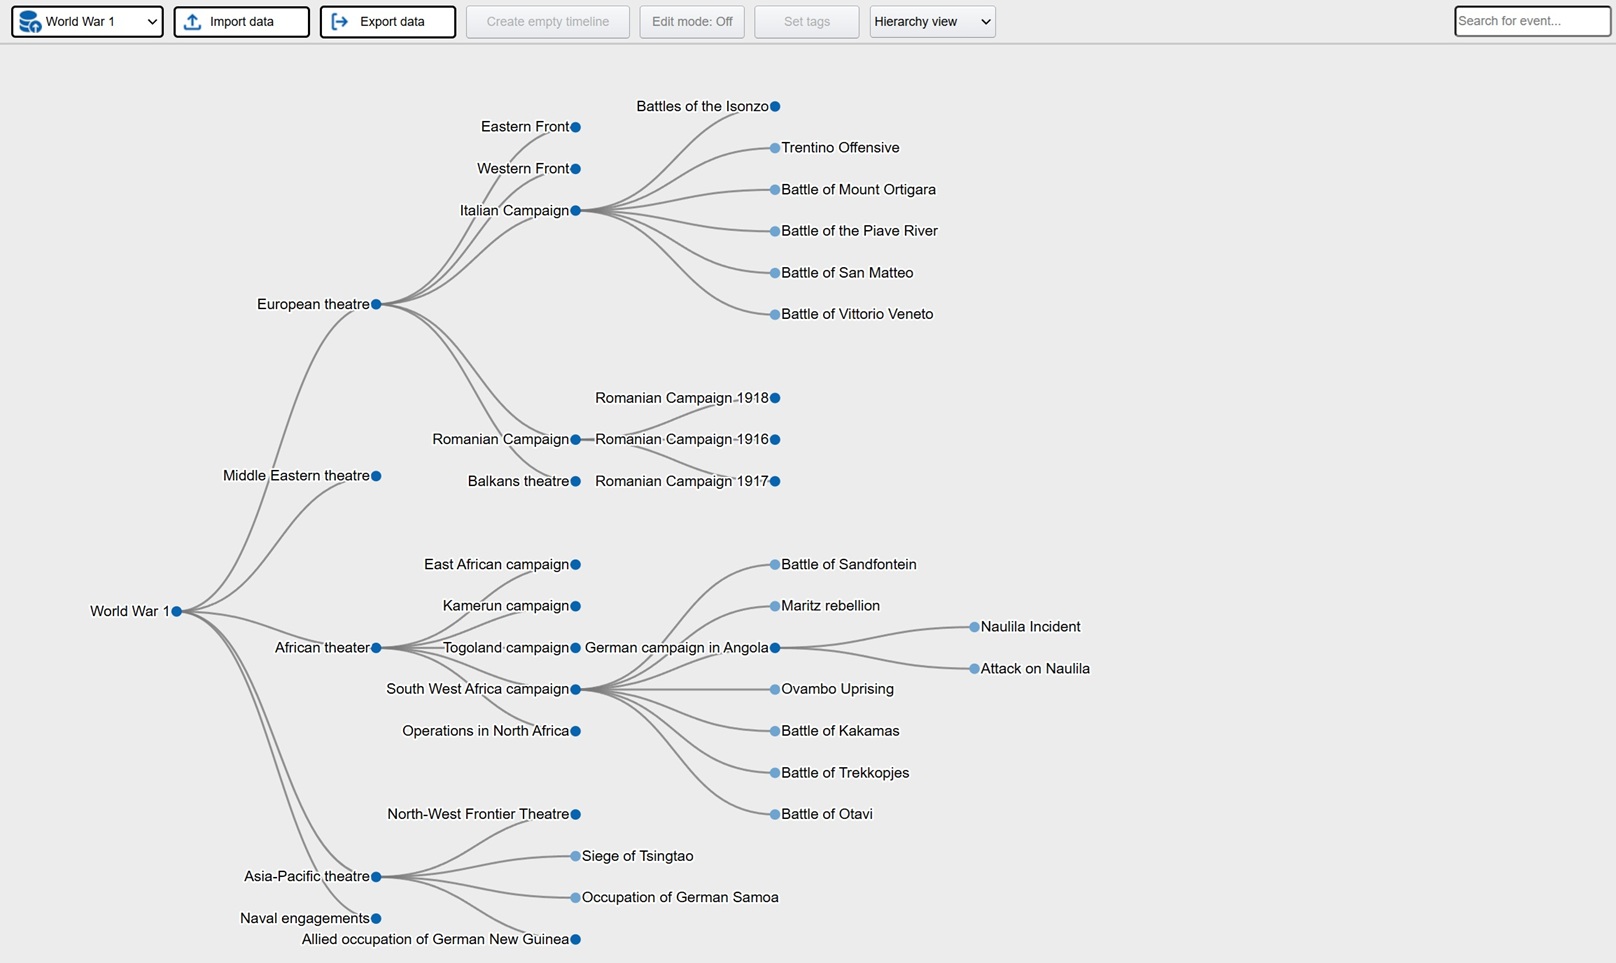
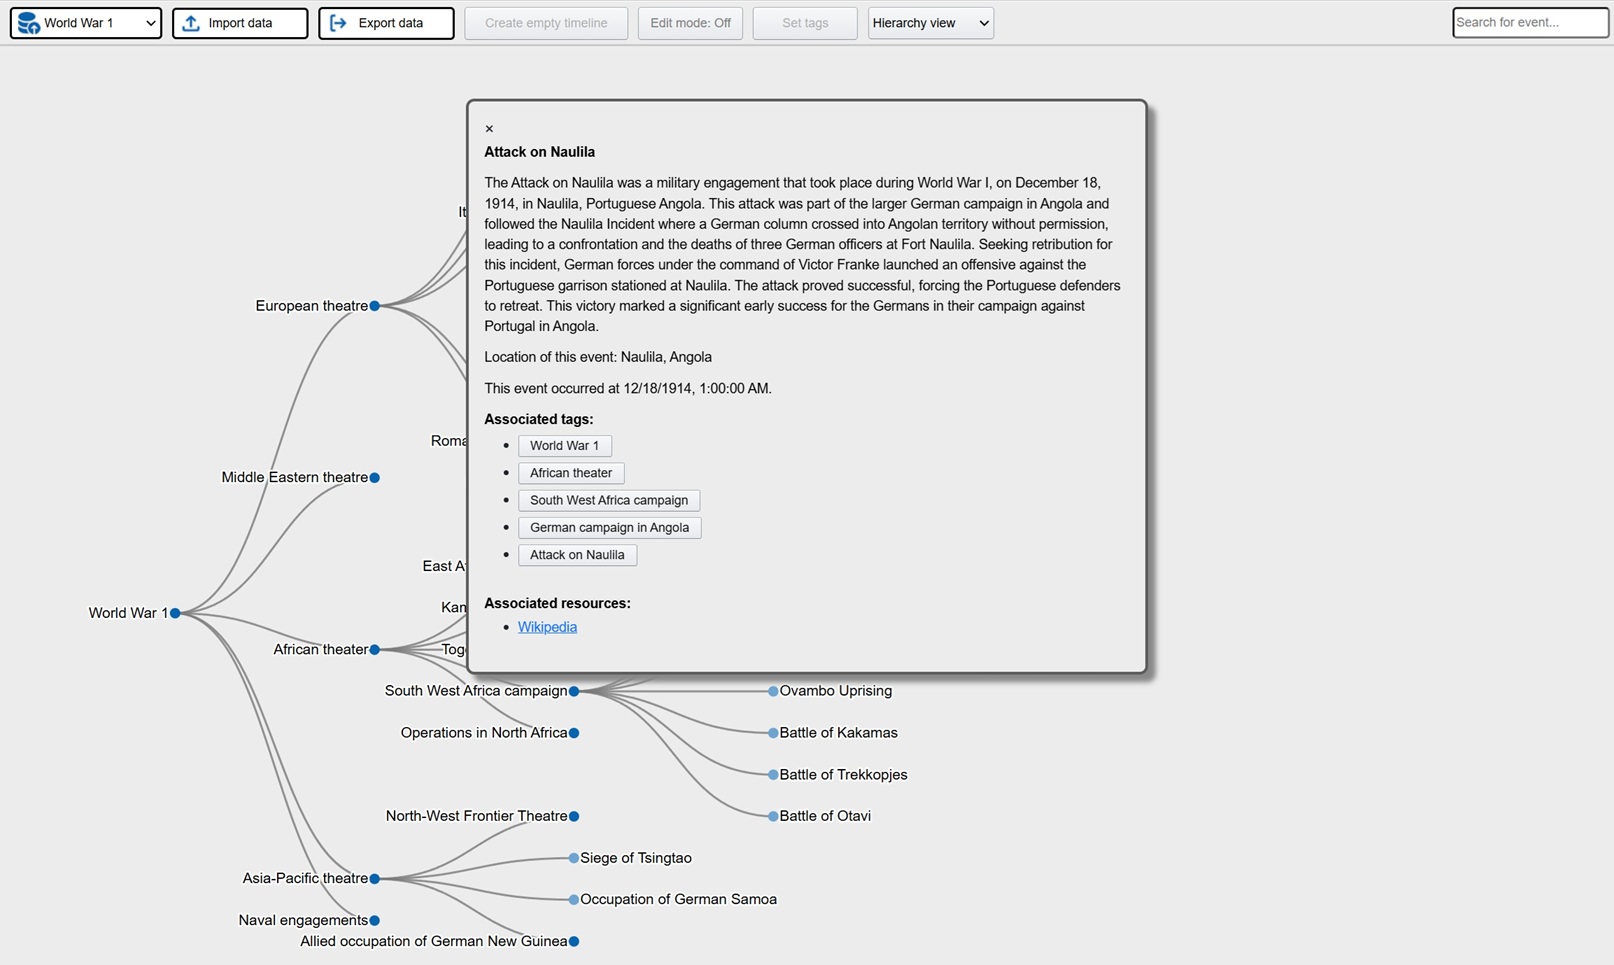
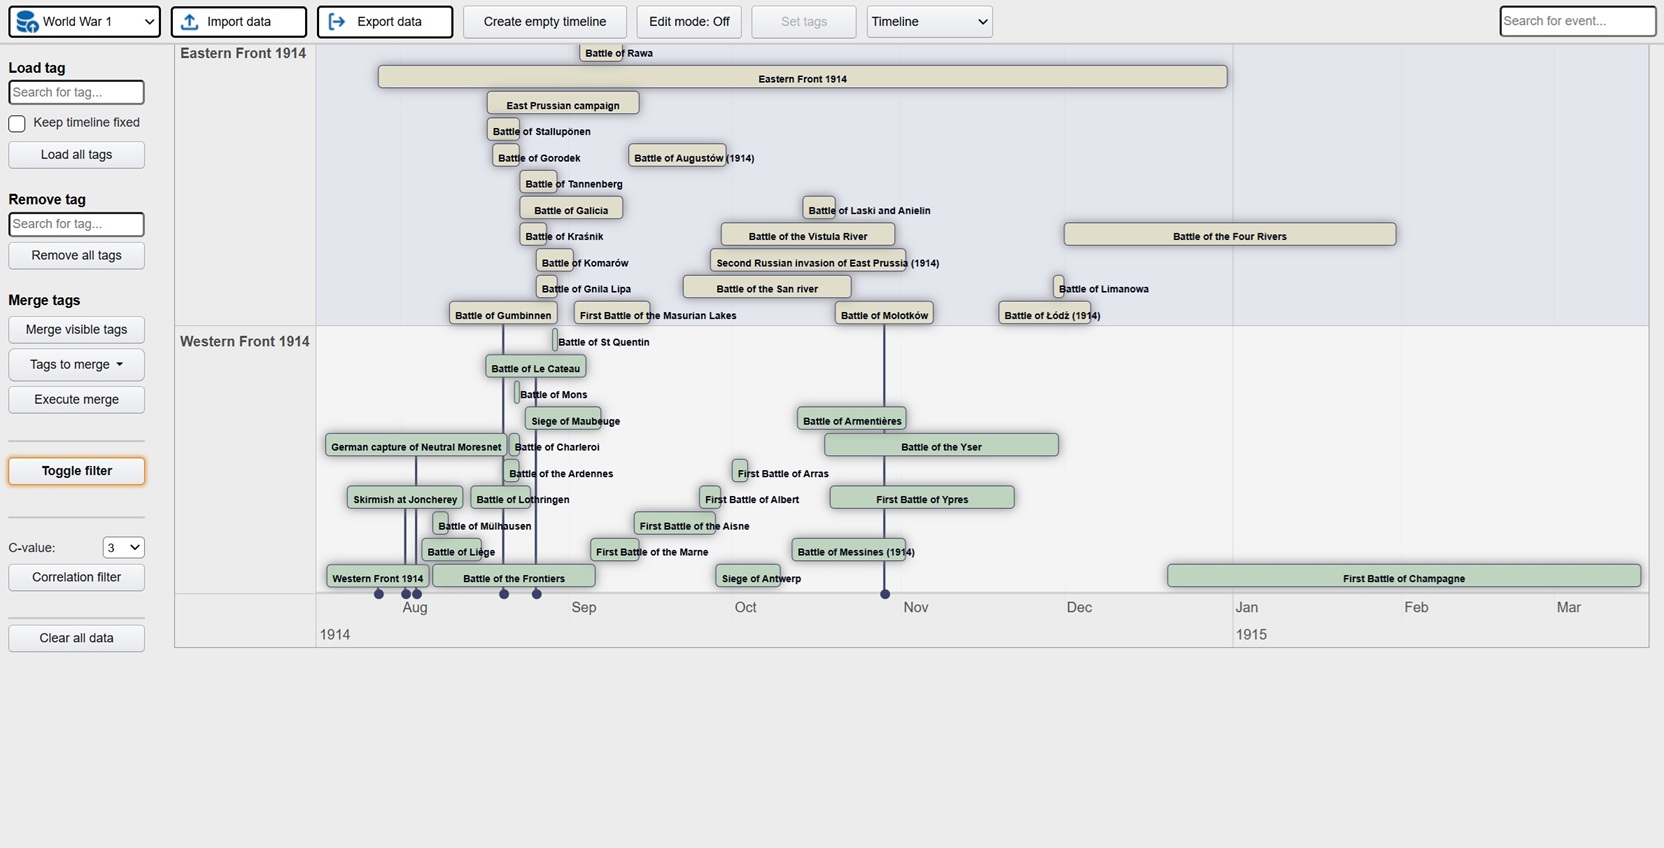
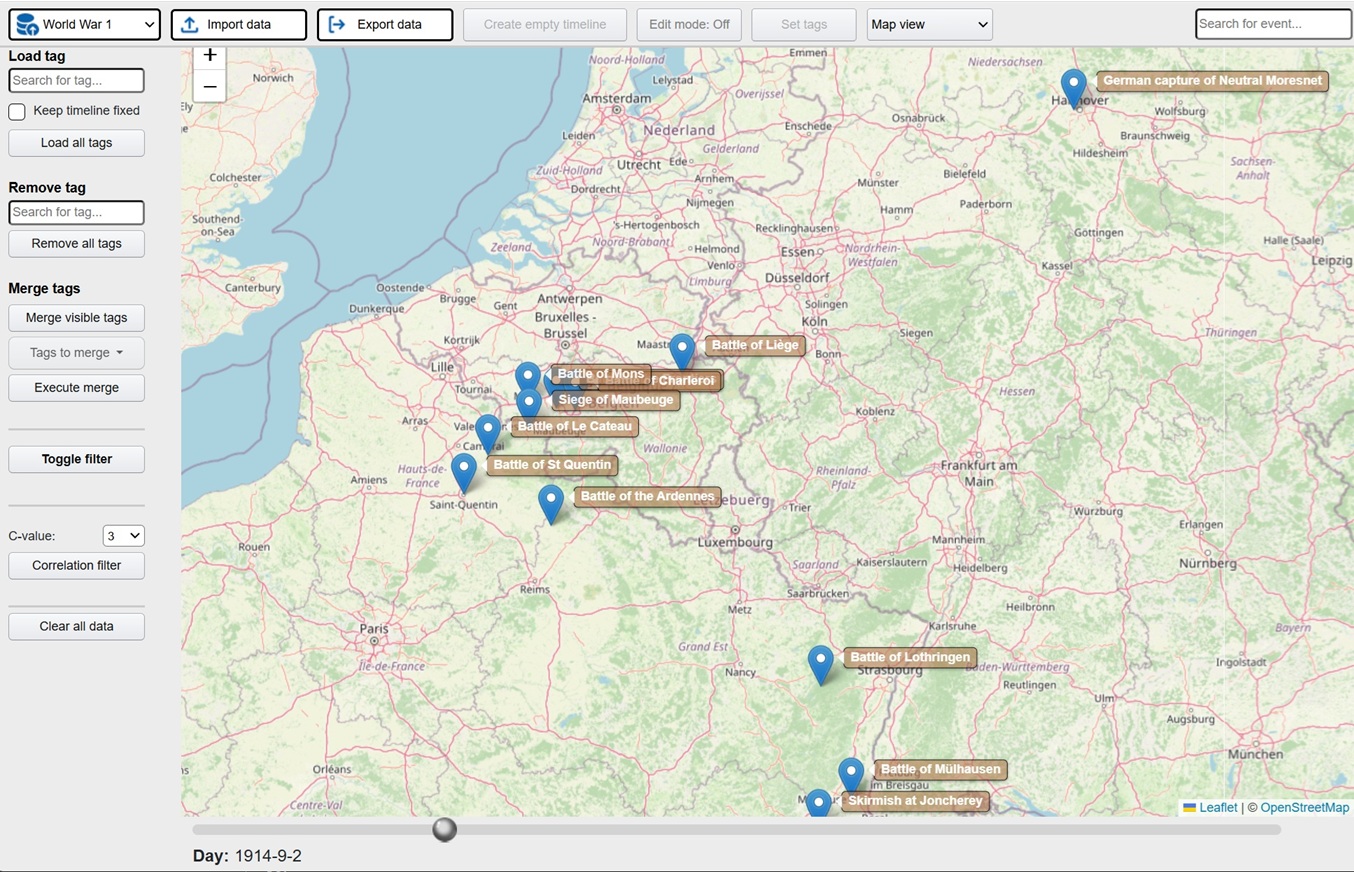
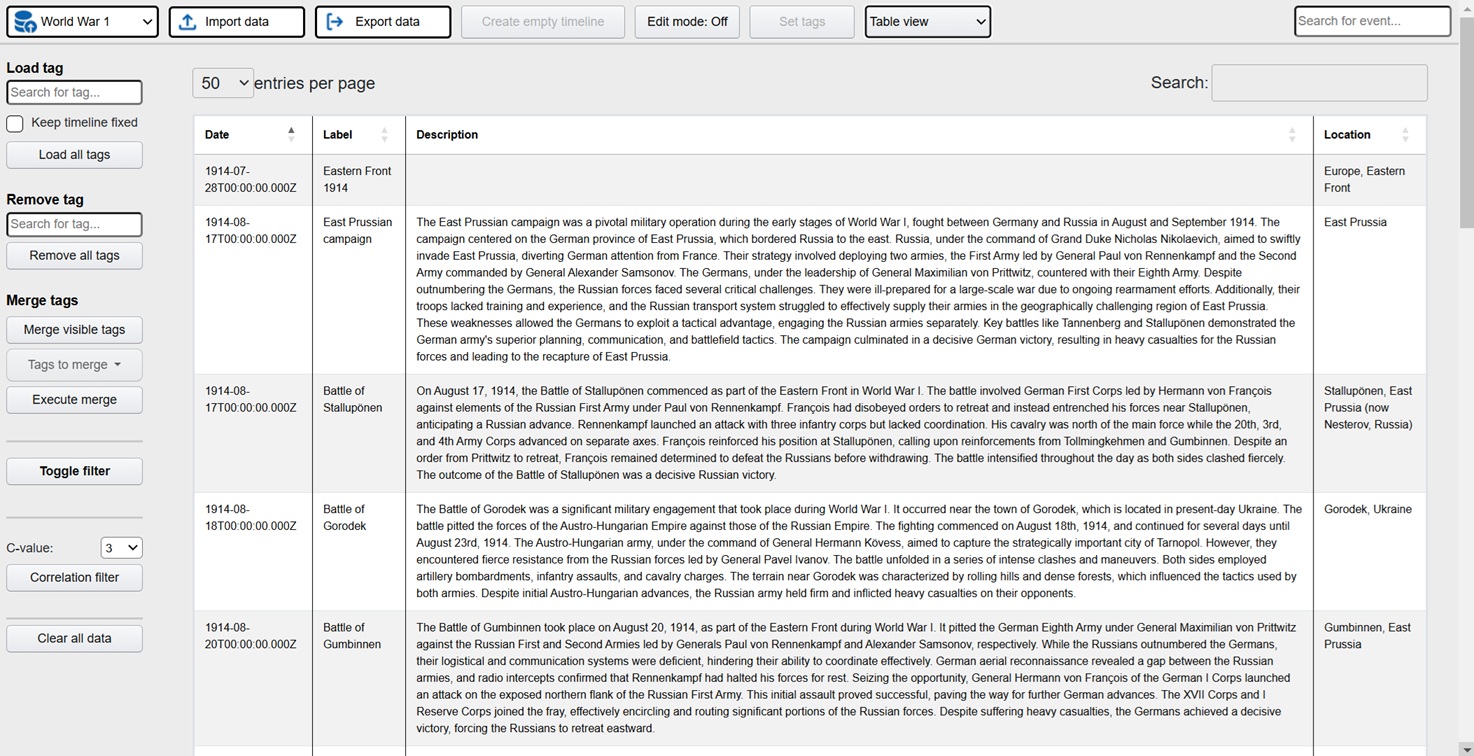
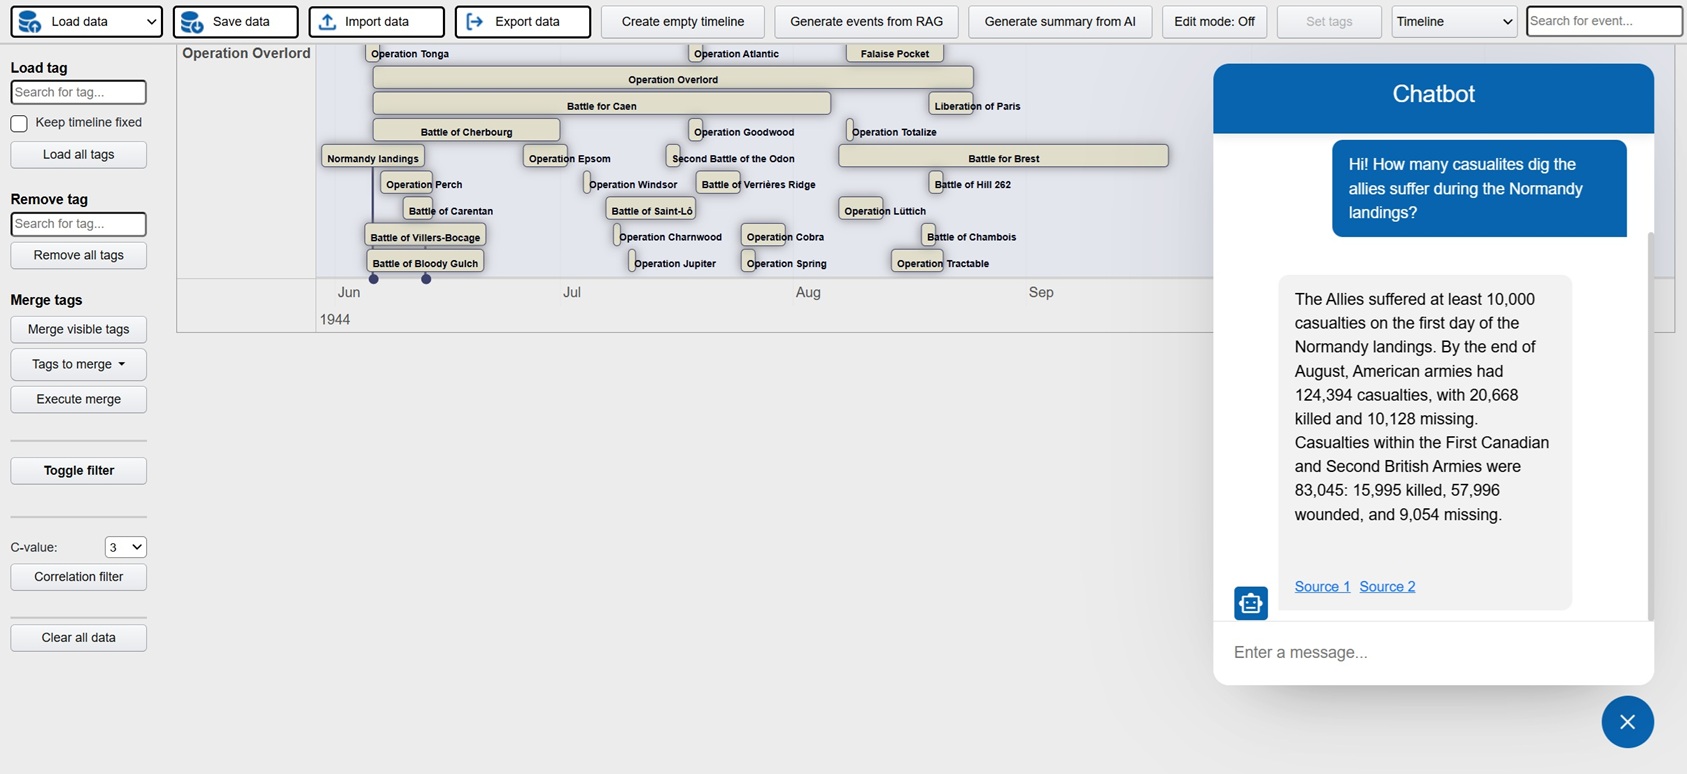
Exploration is a platform where the user visually can explore data in the form of events. At the core is a batch job using generative AI to process large amounts of documents and other data, extracting events in a predefined meta structure. The metalayer contains descriptions (summarization done by the llm), time stamps, location, tags, associated resources and source links. This metalayer is then used for visual representation in the front end app. Typical views are hierachies, timelines, tables and maps. The idea is that the user can explore these events from different angles in order to increase understanding and learning. In the app there is also extensive tools for filtering and processing what the user wants to focus on.
Here is a live demo showing historical events relating to WW1 and WW2. The basis is all available articles on these subjects from english wikipedia. All in all more than 1400 articles that the ML batch job processed and then extracted structured events containing summarizations, timestamps and locations (converted to latlong through nominatim). The preparations took 2 days and the actual running time of the batch job was 2 hours. This is the raw output, so a few locations are wrong and need to be fixed.
Note that any kind of events can be processed and used in this way, not only historical events. Ex internal company documentation regarding projects, audits or pretty much anything. Typically the data would not be as structured as wikipedia, so more preparations and processing would be needed to achieve desired results. Additional features are a super fast search for all events, as well as a chat where the user can ask free text questions (not available in the demo).
FE: Javascript, jquery, Bootstrap 4, vis.js, D3, Datatables, leaflet/openstreetmap
BE: Fast API, python, sklearn, nominatim, MongoDB, llamaindex, Ollama, Chroma Vector DB. Models: gemma2 27B quant 4,BAAI/llm-embedder, BAAI/bge-reranker-base
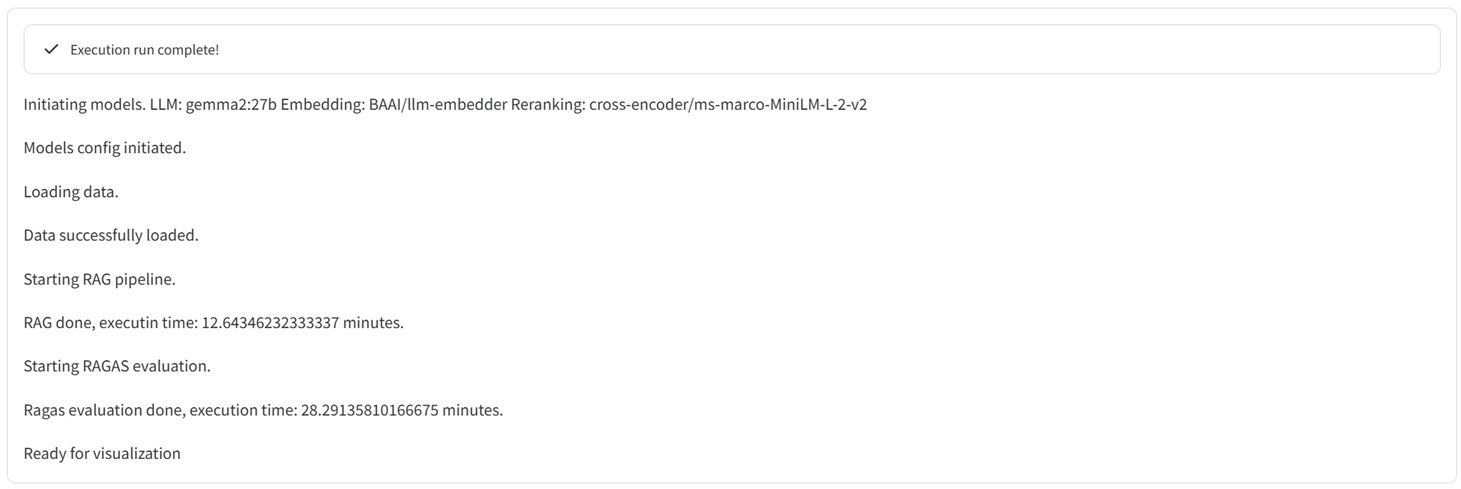
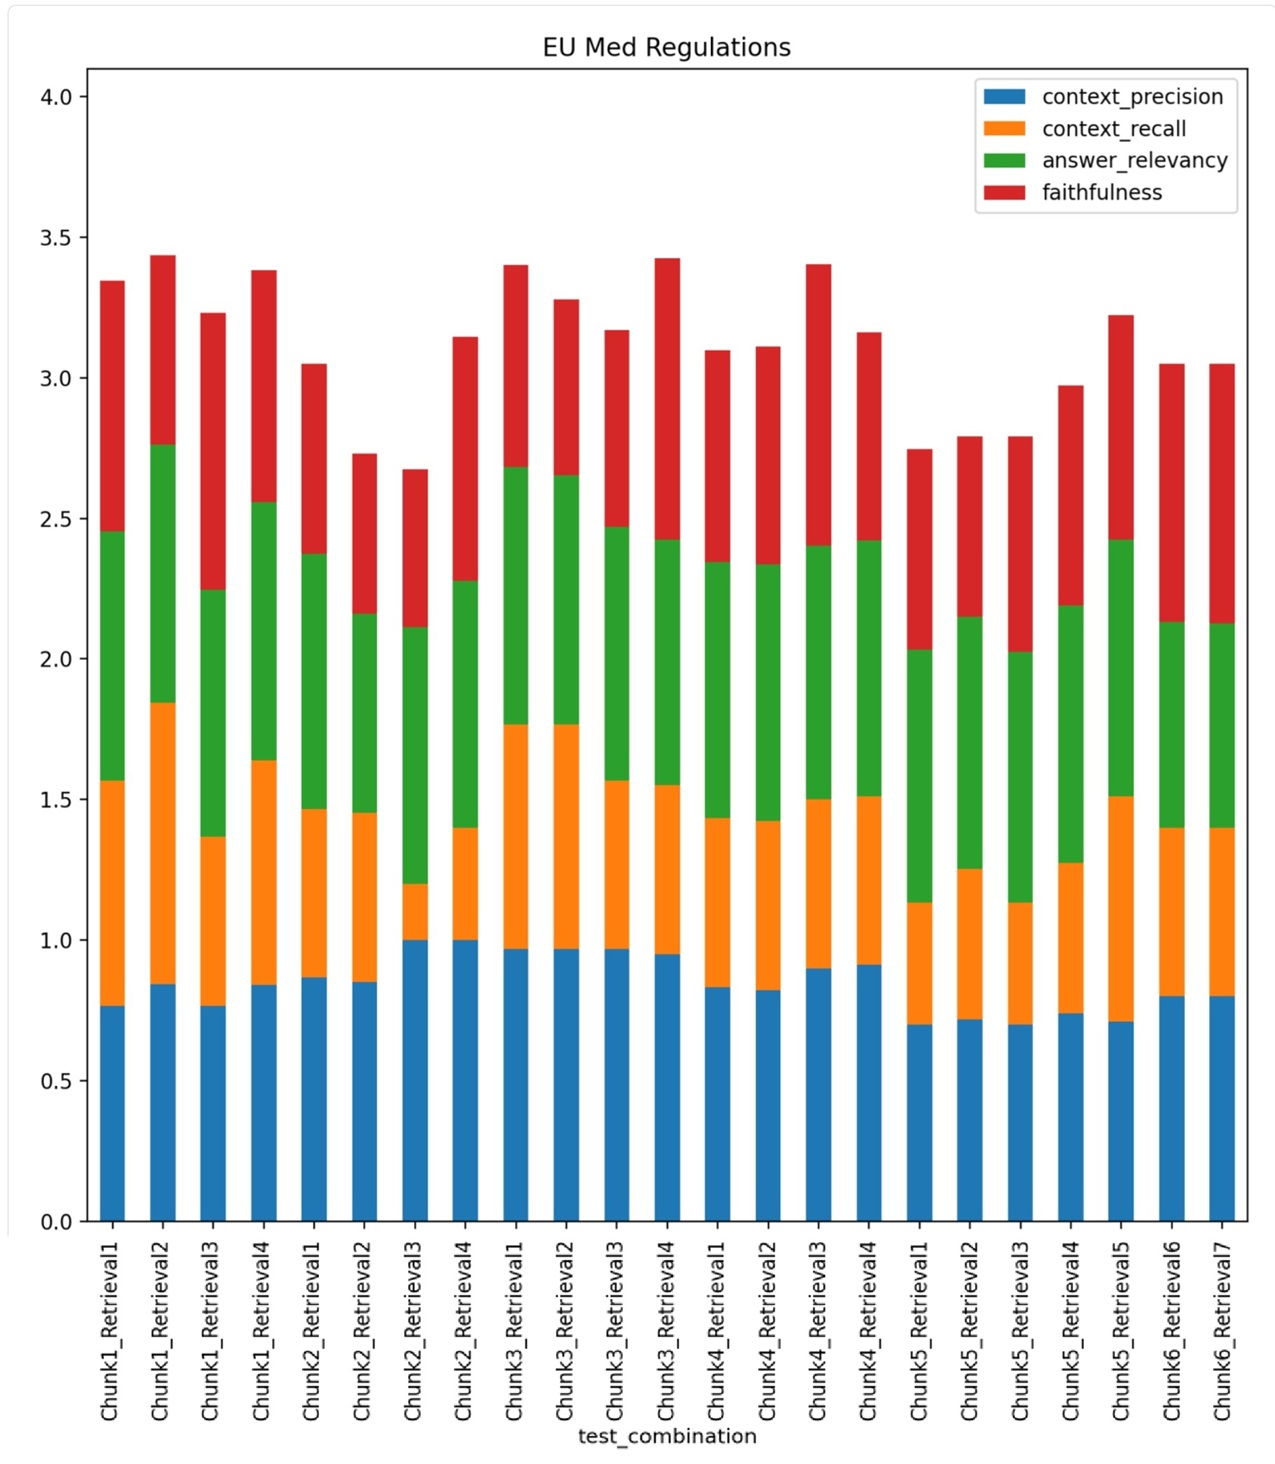
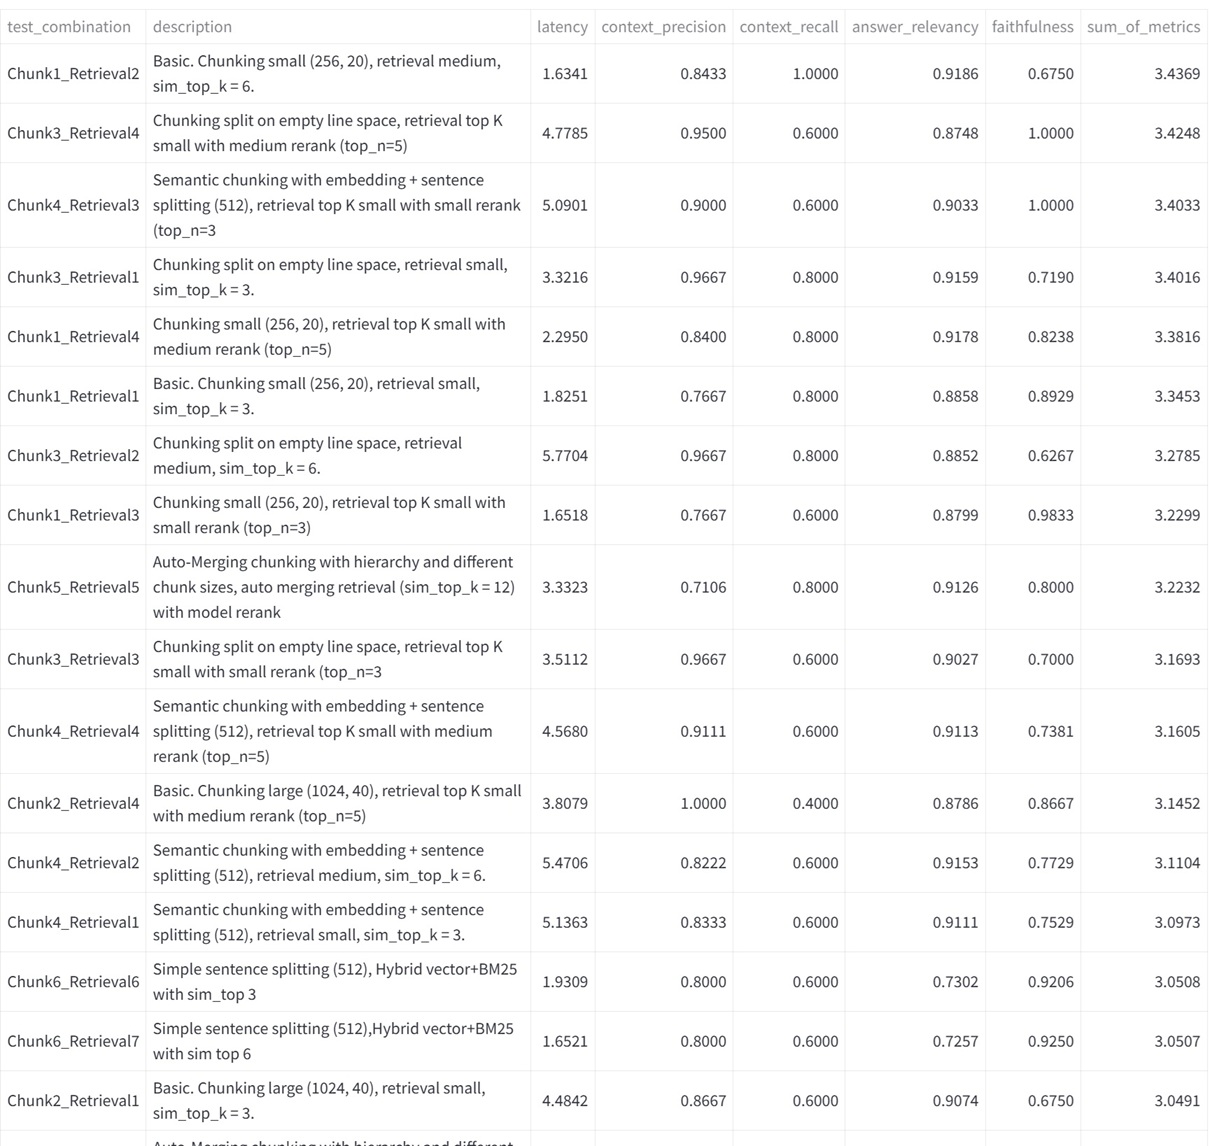
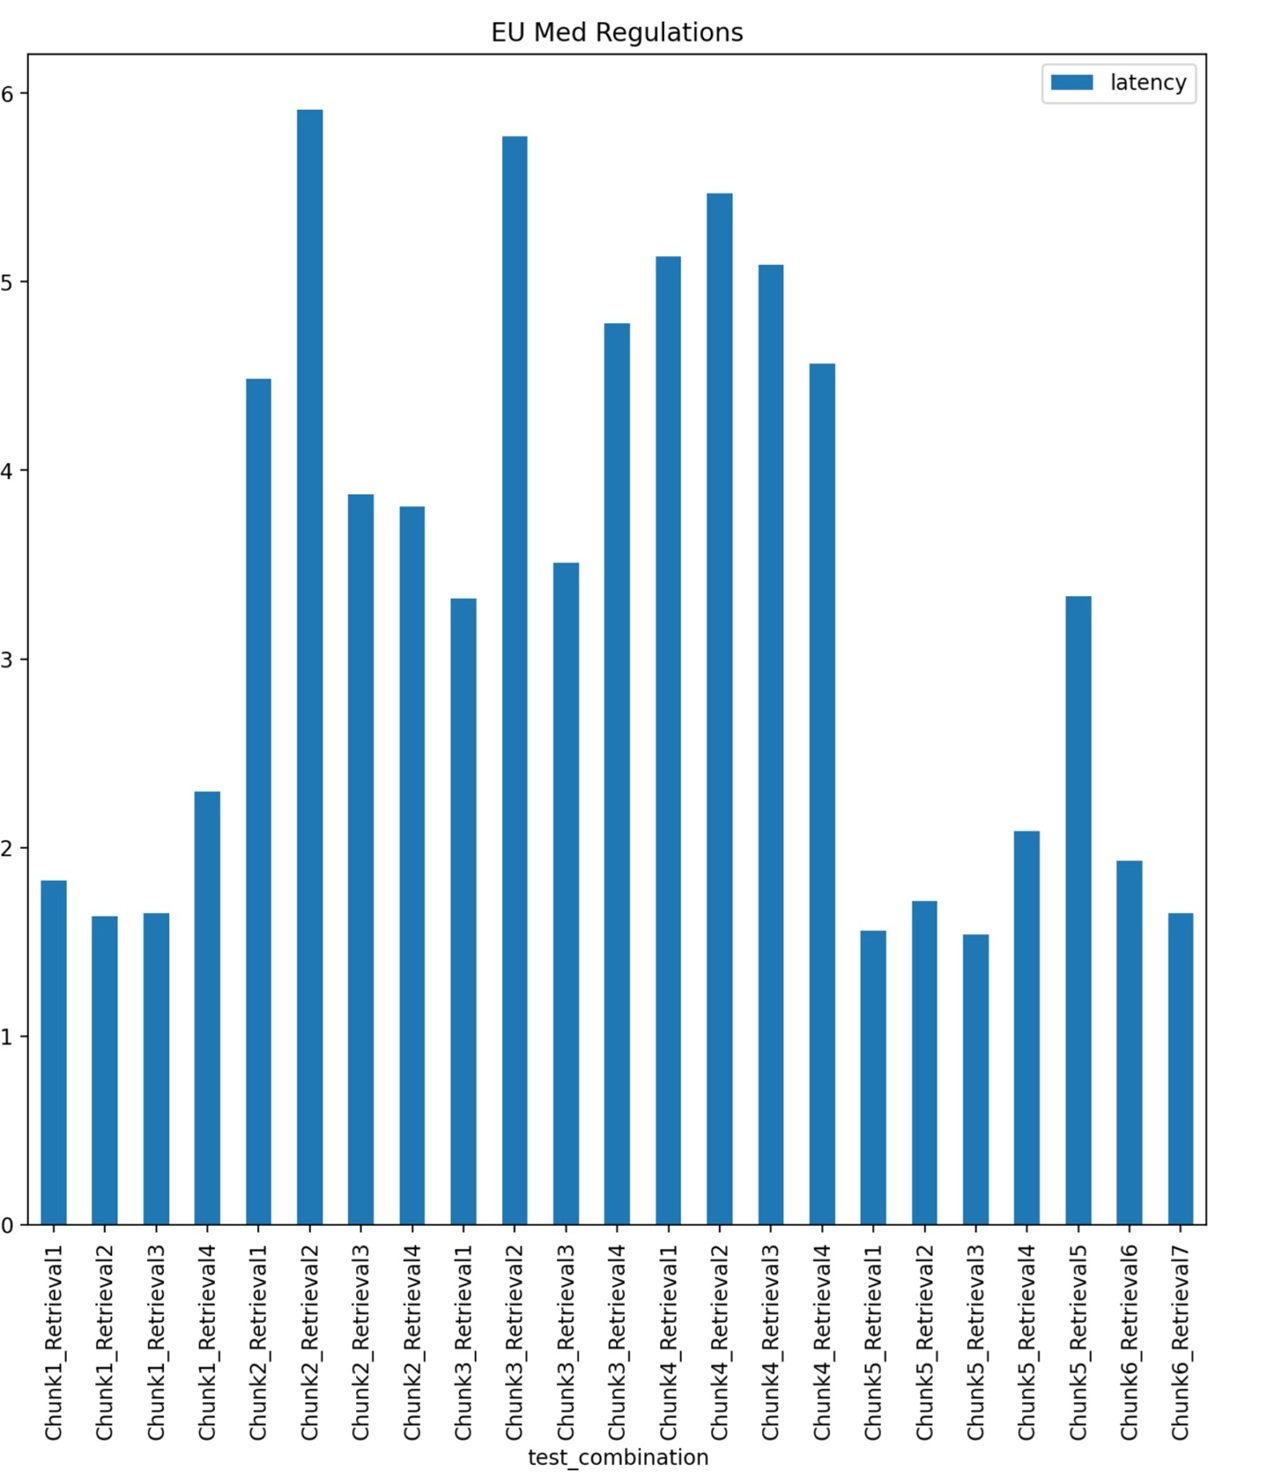
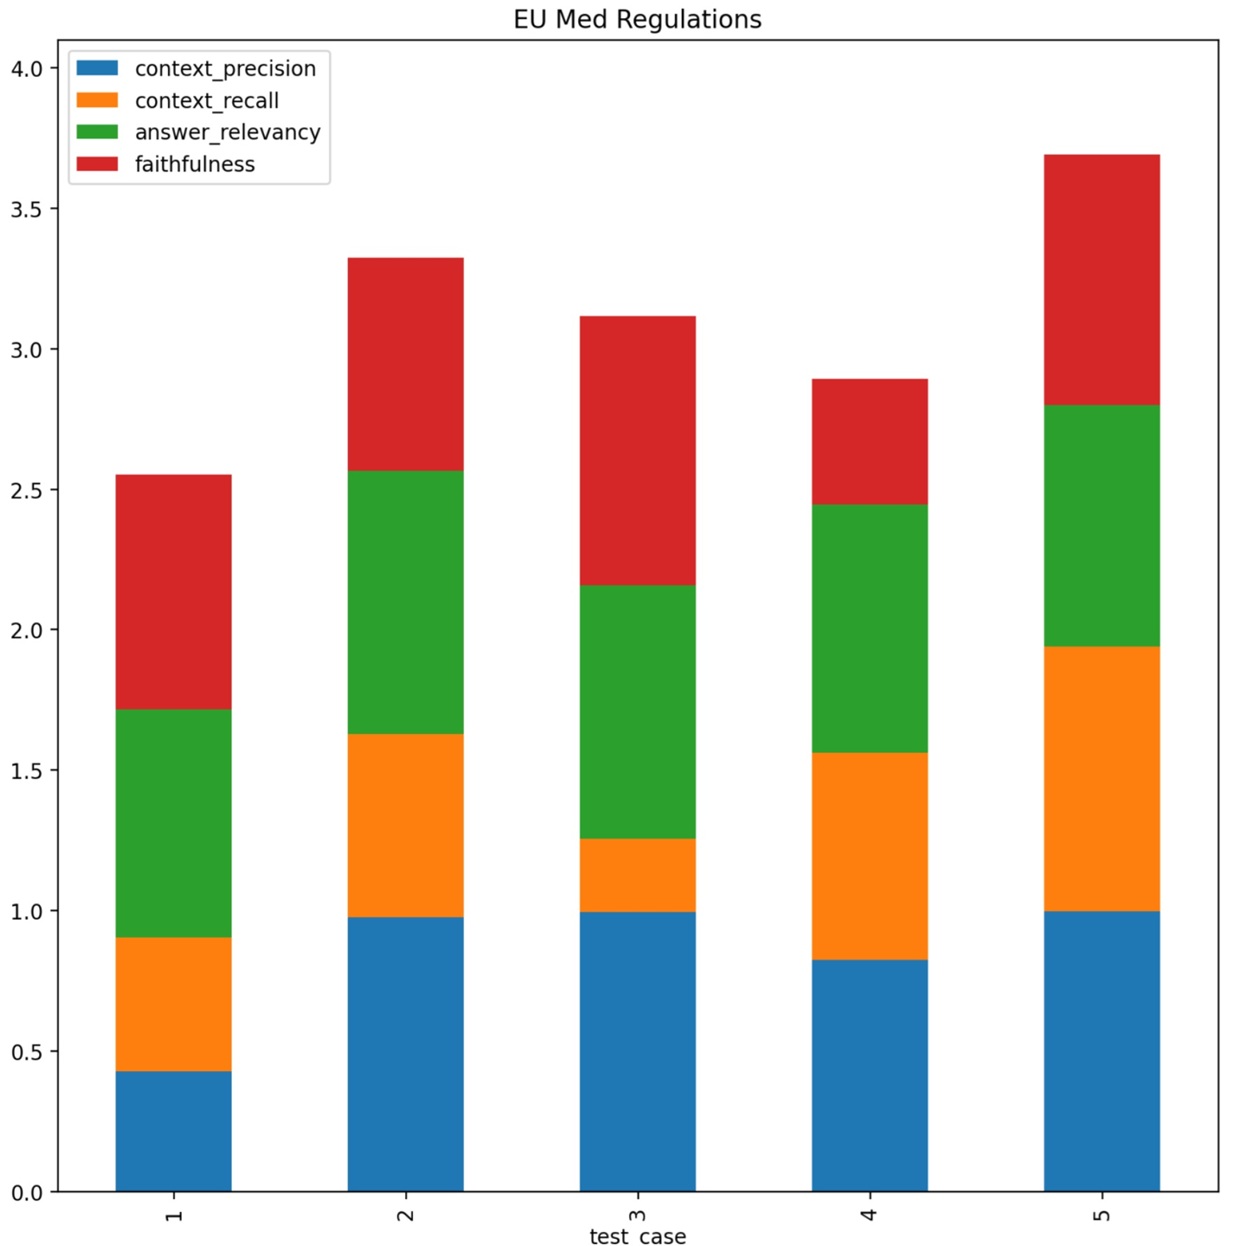
The RAG Test Bench adresses a problem every one who wants to build a RAG (Retrieval Augmented Generation) system sooner or later faces. For a specific text aimed for processing, there is a huge amount of configurations and choices to handle in order to produce the best possible outcome. I e an accurate, to the point response without hallucinations or other unwanted side effects. This includes chunk size, number of chunks, top k retrieval, reranking, hybrid search/embedding etc etc... Currently the tools consists of 23 combinations of parameters, but more can easily be added as new frameworks and methods appears. The RAG Test Bench is used by setting up a sample document representative of the data structure at hand, as well as a set of predefined questions/answers. It then loads the choosen llm and executes these question with all the permutations of configurations. The responses compared with the true answers are then measured through an llm using the Ragas framework which gives us evaluation data (Context Precision, Context, Recall, Answer Relevancy, Faithfulness) as well as latencies. The output will then tell us which configurations works well or not so well on the choosen data structure. Doing this not only saves many, many hours of manual testing, but also brings an element of certainty that we have indeed choosen the optimal configuration for our use case.
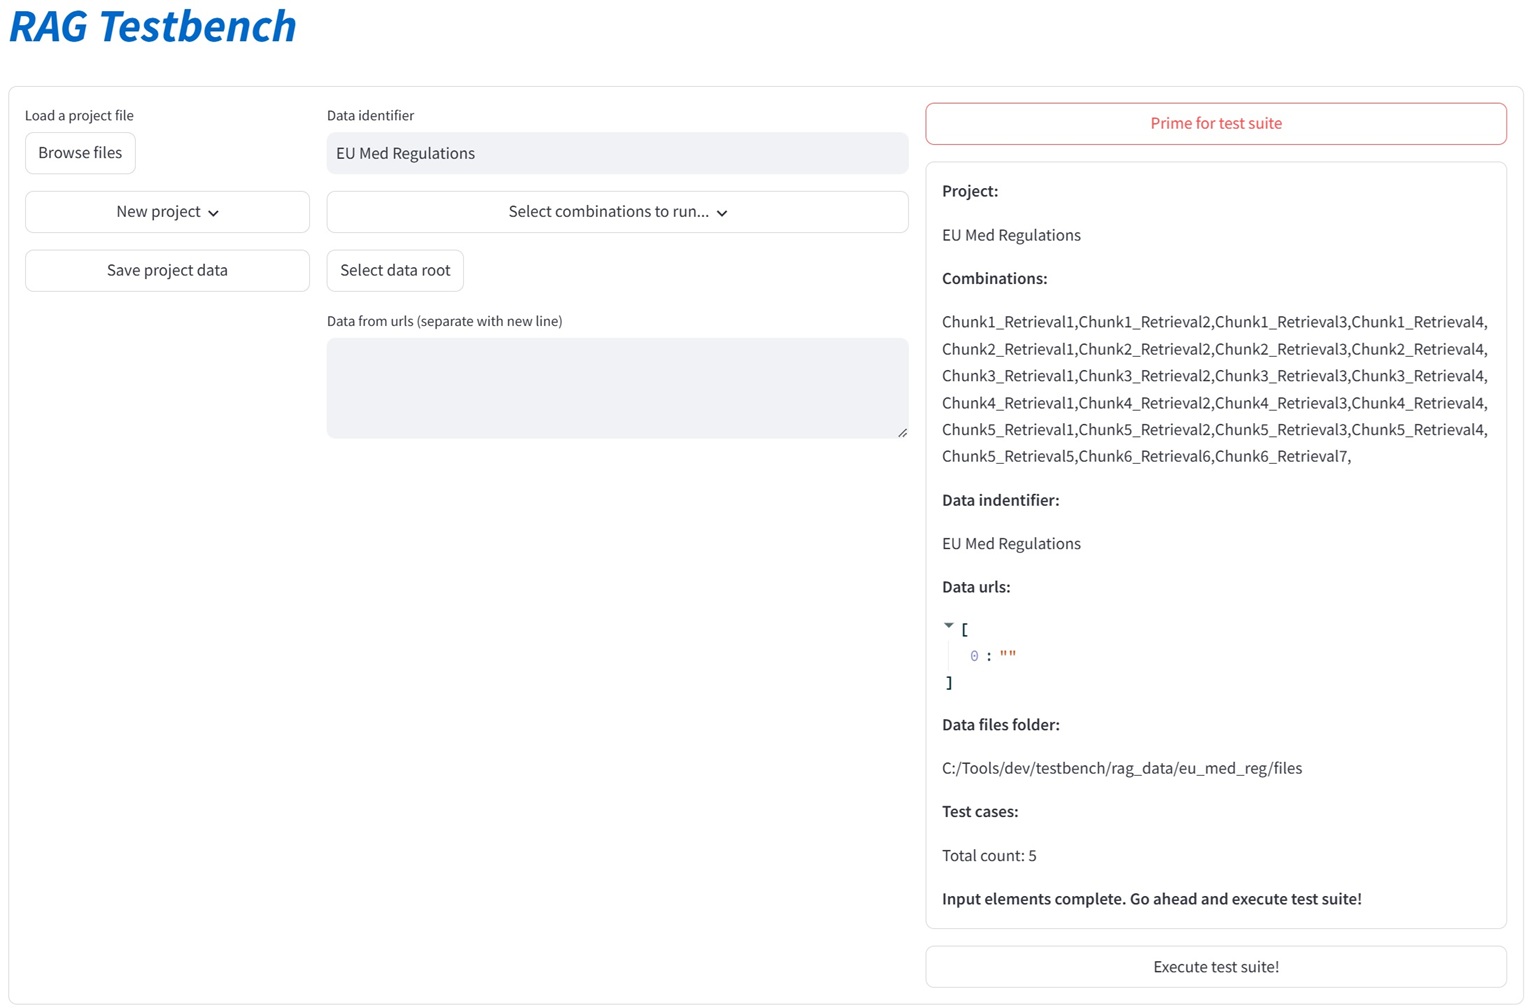
Streamlit, Python, llamaindex, langchain, ragas, transformers, torch, ollama, matplotlib, pandas
Models: gemma2 27B quant 4, GPT-4o-mini(for ragas), BAAI/llm-embedder, BAAI/bge-reranker-base
The Global Wine Map is a site adressing the lack of useful digital tools in the world of wine enthusiasts and sommeliers. The site is a interactive map of more than 500 wine regions in 18 countries where the user can explore regions and subregions by navigating the map and zooming in. For each region there is also a description of history, climate, soil, grapes and wine styles. For sommeliers in training there is also a quiz engine (on desktop/laptop) where knowledge of the geographical locations of wine regions and appellations can be tested. The site is the worlds most comprehensive interactive wine map tool and widely used by sommelier schools around the world.
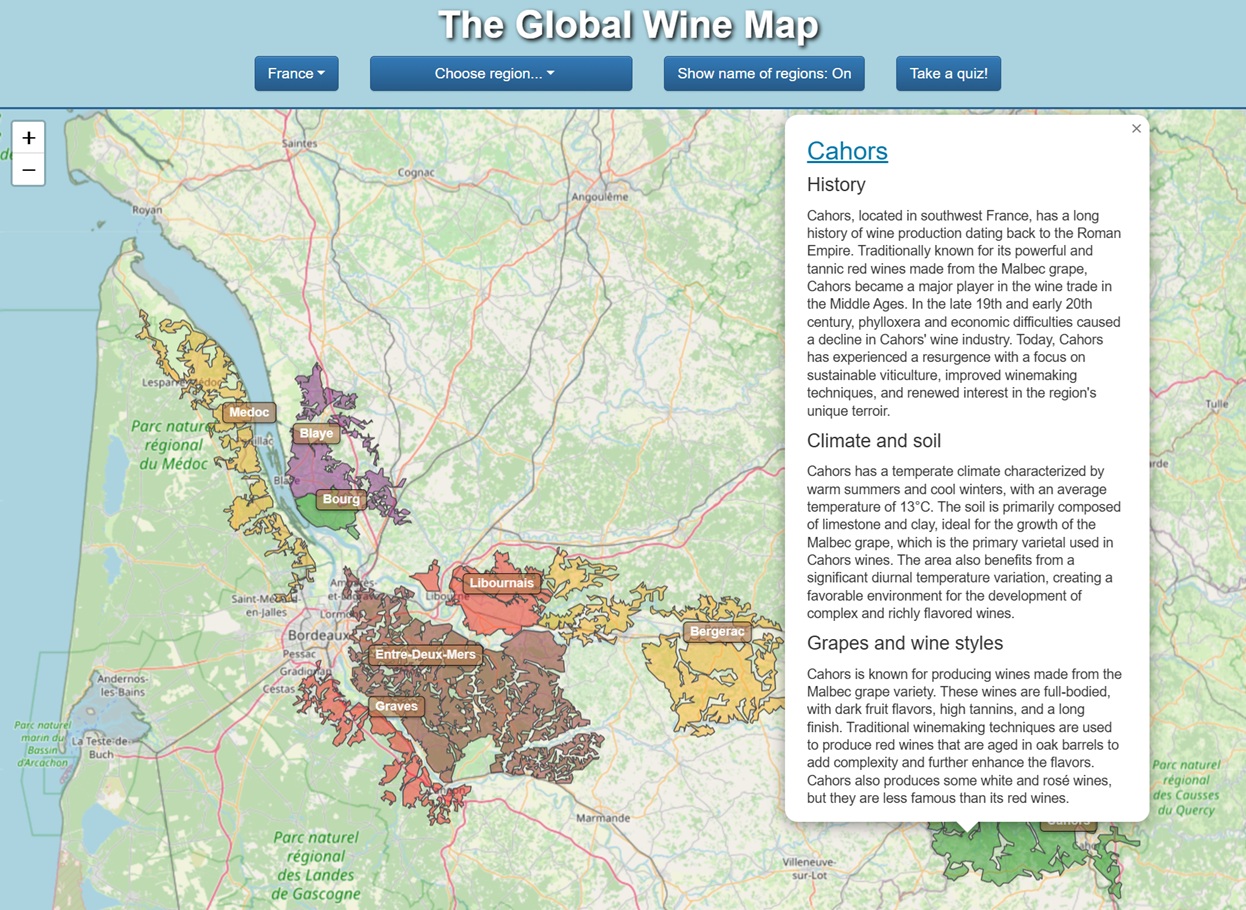

FE: Javascript, jquery, Bootstrap 4, leaflet/OpenStreetMap, Google Maps API.
BE: Python, Open AI API
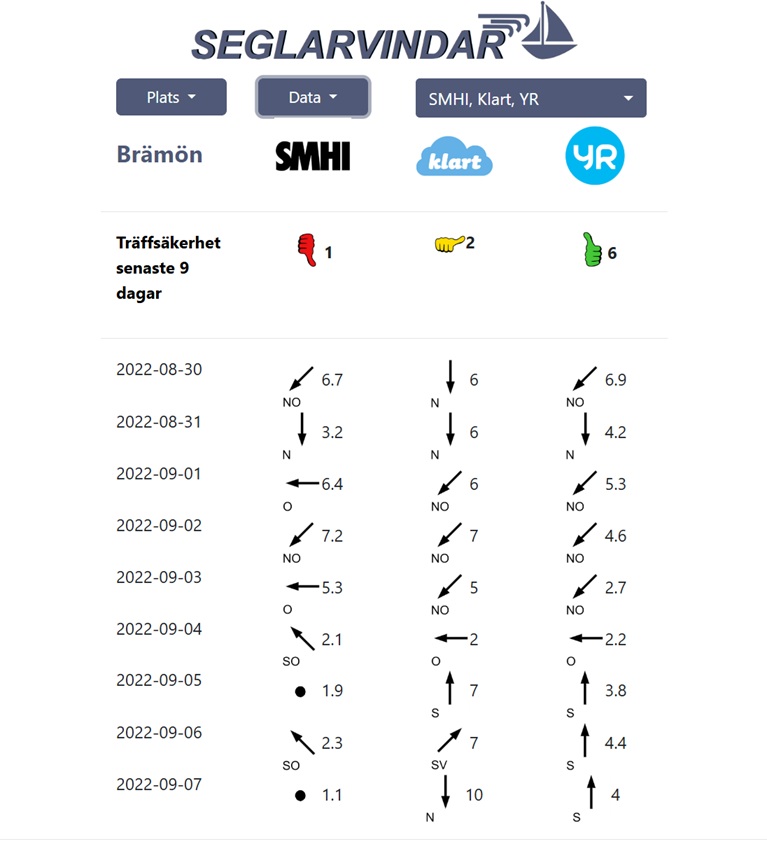
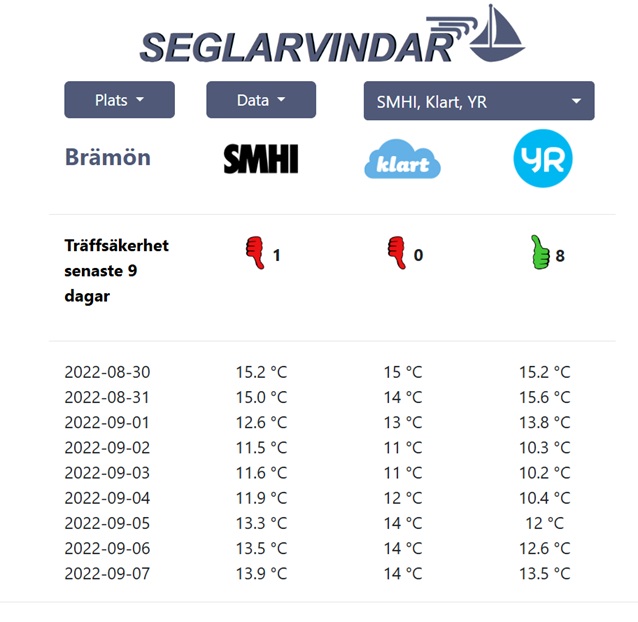
Seglarvindar was a site ranking wheather forecast providers. Focusing on coastal locations the main purpose was to give recreational sailors and windsurfers the most accurate data when it came to windspeed, winddirection and temperature. Through API calls and scraping wheather forecasts were collected each day from the main Swedish providers. This data (typically 10 forecasts for one target day) were persisted and then compared with the actual result (as fetched from SMHI's weatherstations on that location). The data made it possible to have a rolling window for the last 10 days where the best forecast provider for each target date earned a point. The highest accumulative points for the last 1O days would show which provider had the best track record, and likely would produce the best forecast for the coming 10 days as well. In addition we tried to use custom algorithms (including recurrent neural networks) to make our own 10 day forecast based on the success patterns of the providers forecasts, but we never managed to beat the best provider. Probably the patterns were to weak and the data too stochastic for it to work.
The site was live from June to September 2022. It was well liked by many users, but for it to be fully useful a lot more data needed to be added. This in combination with volatility of the data retrieval from the weatherstations (operational support) brought us to the decision to decomission the site. The old site, frozen in time, is available here.
FE: Javascript, Bootstrap 3.
BE: (data collection and processing) Python, crontab
Have questions or suggestions? Feel free to reach out to us at info@katalsolutions.com.